How fast is CCXT in each of its six languages? We measured every layer
A like-for-like benchmark of CCXT across all six languages — JavaScript, Python, PHP, C#, Go, and Java. Why REST latency tells you almost nothing about a language, what a no-CCXT control run reveals about measuring it, how fast each language really parses an order book, and why the two compiled languages end up the slowest.
By CCXT Team
CCXT ships the same trading API from a single TypeScript source, transpiled into six languages. The obvious question: does the language you pick change performance? Is a PHP bot slower than a Go one? Does Python use more memory? Is a compiled language always the fastest?
The answer has three layers, and they don't agree with each other. So we measured all three, across all six languages — JavaScript (Node), Python, PHP, C#, Go, and Java — plus a first look at the in-progress Rust port:
- REST latency — is a
fetchOrderBookcall slower in one language than another? - The library's own speed, with the network removed — how fast does each language actually parse an order book?
- Memory — how much does each runtime carry?
The code is in the repo
(examples/benchmarks/) and
you can reproduce every number.
1. REST latency: it's the network, not the library
Here is the short version, and it is the least interesting result in this article: for REST calls, the language you pick does not matter. Not "matters a little" — the difference is smaller than the noise you'd have to measure through to see it.
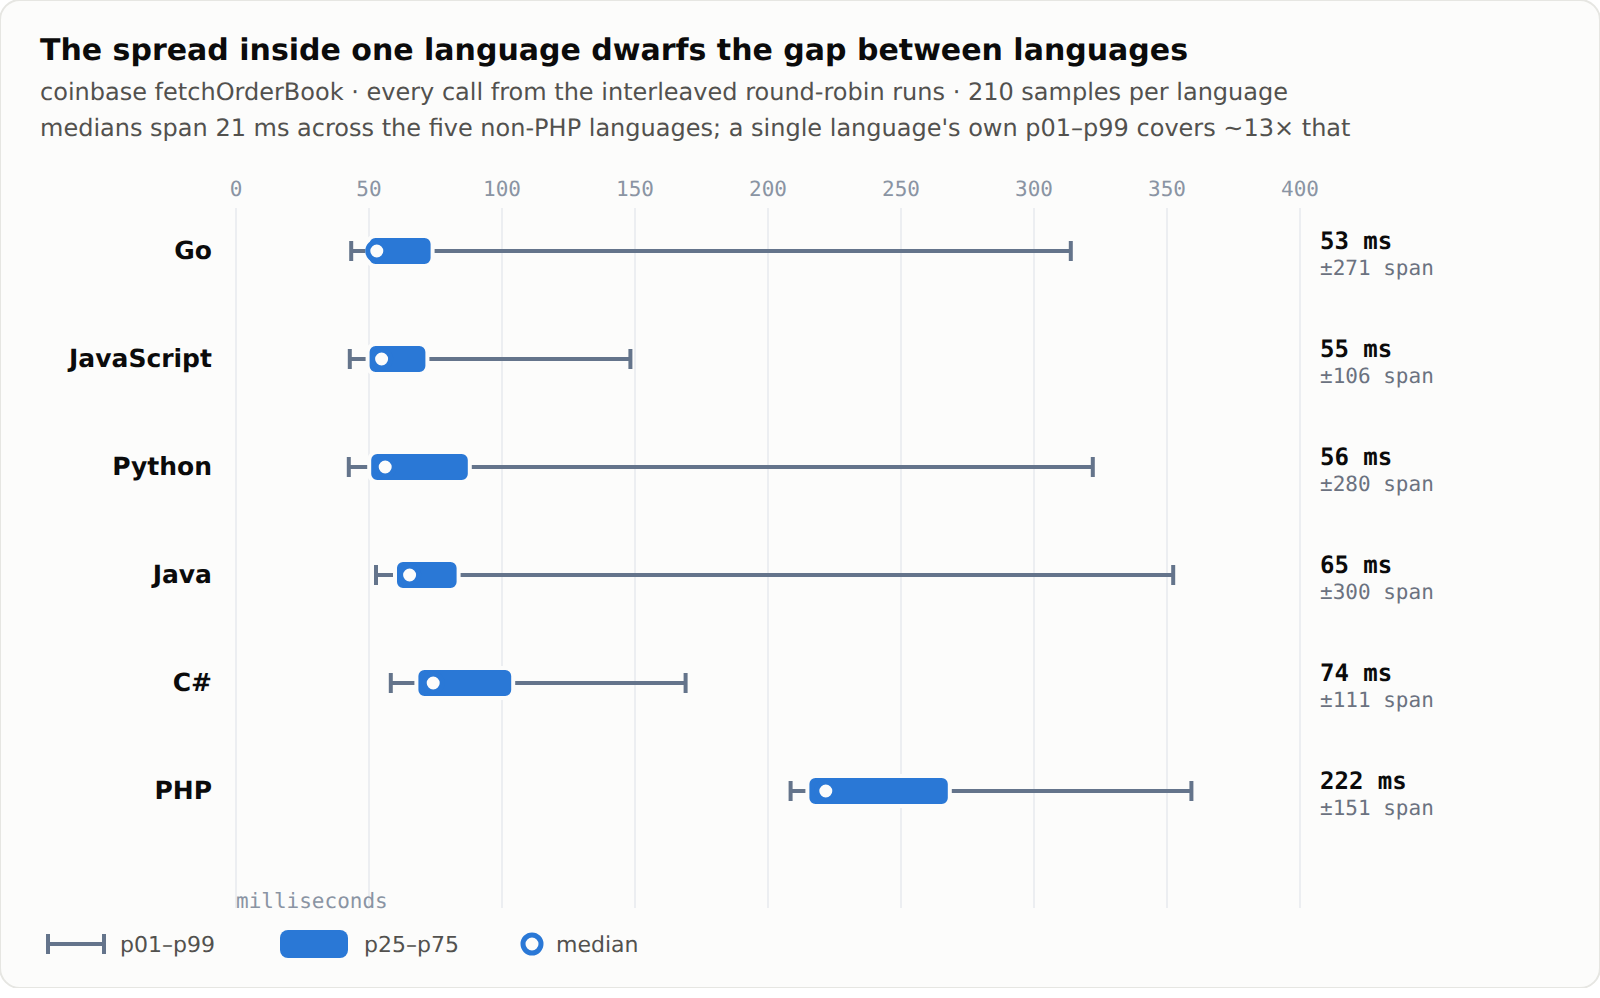
Every call from the interleaved runs, plotted as a distribution rather than a single number (210 calls per language). The medians of the five non-PHP languages span 21 ms. A single language's own p01–p99 covers 106–300 ms — a median of ~270, or about 13× the gap between the languages. Go's p99 is 314 ms: one unlucky call in the fastest language is slower than a typical call in the slowest.
CCXT's own contribution to any of this is 2–7 ms depending on language. So the quantity you'd be picking a language to optimise is roughly a tenth of that language's own run-to-run spread. Unless you are counting single milliseconds on every request, pick the language your team already knows.
PHP is the exception, and it's a bug, not a language. Its 222 ms median is roughly 4× everyone else, in every round. The clean way to see that it is real and not noise: PHP's first percentile — its best call in 210 — is 209 ms, higher than every other language's p75. The tails overlap, but the bulk of the distributions don't come close. The cause is the ReactPHP connector opening a fresh connection per request, so every call pays a TCP+TLS handshake. Fixable; see §6.
The rest of this section is how we know that, because our first attempt at measuring it was wrong and the way it was wrong is instructive.
How we know — and how we got it wrong first
The obvious approach is to instrument CCXT: wrap fetch() (the HTTP layer) and parseJson()
(the decode inside it), call the difference "network", and call whatever's left "processing".
We did that, ran each language in turn, and got a table showing C# spending ~20 ms more on the
network than Python. That result was wrong twice over.
First, the runs weren't interleaved. Latency from any one machine drifts minute to minute, with a heavy tail — 100–200 ms outliers show up in every language, every run. Six languages measured in six consecutive windows are not comparable to each other.
Second, and more important, fetch() − decode is not wire time. It also contains whatever
else that language's HTTP layer does inside the call, and those boundaries are not the same
across six independent implementations.
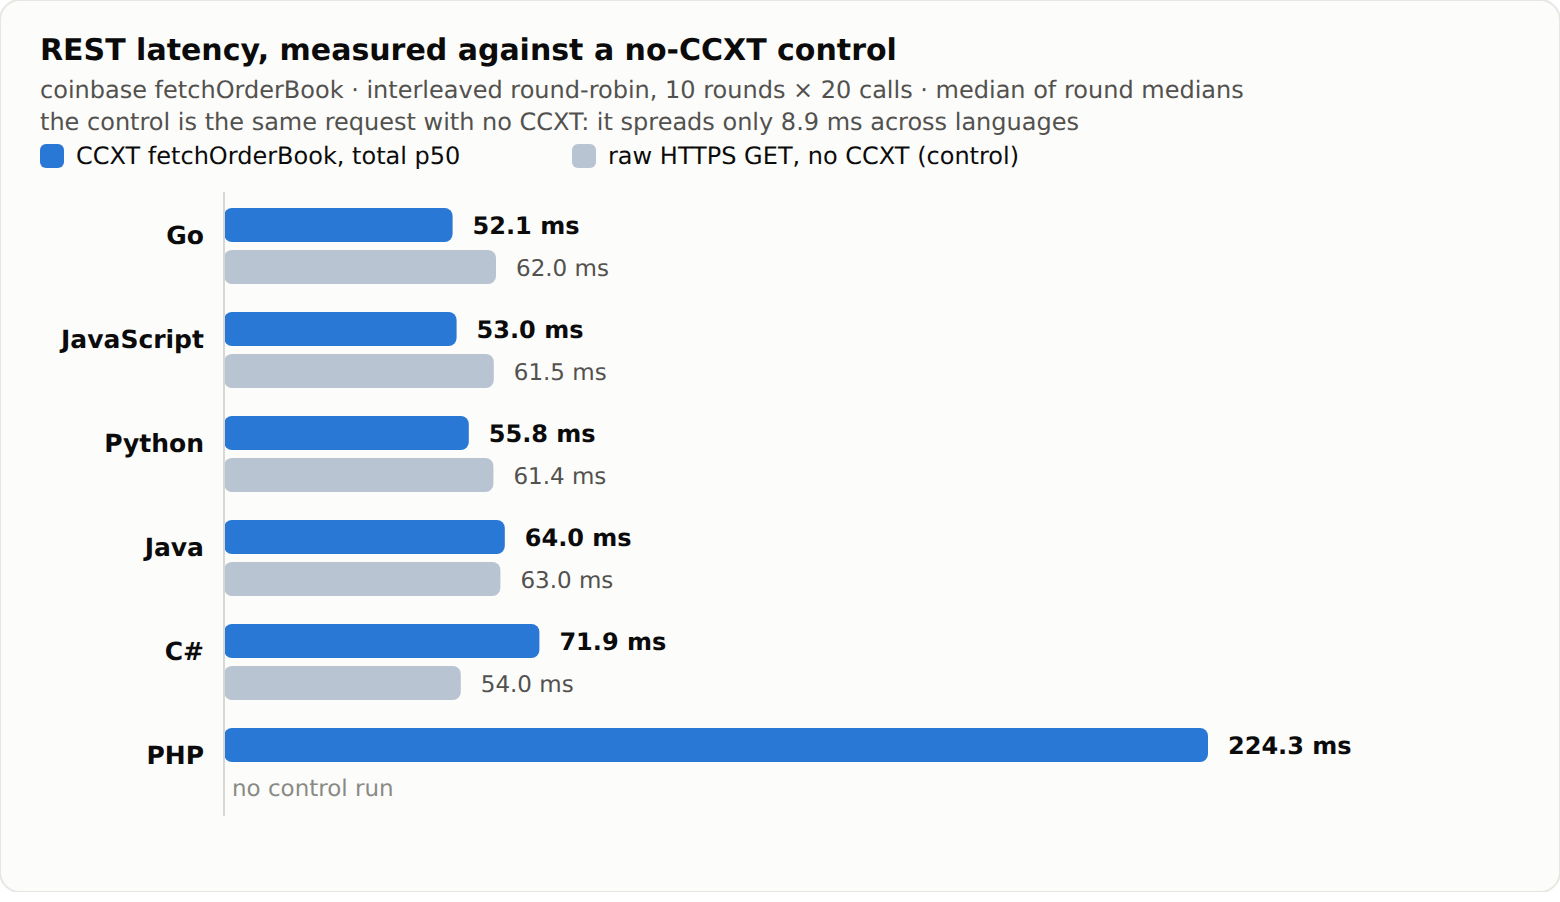
So we added a control: a plain keep-alive HTTPS GET to the same endpoint with no CCXT at all, one per language, run round-robin against CCXT's own client so both share the same network window. Six rounds:
| Language | raw client | CCXT "network" span | difference |
|---|---|---|---|
| C# | 54.0 ms | 69.7 ms | +15.6 ms |
| JavaScript | 61.5 ms | 47.3 ms | −14.2 ms |
| Python | 61.4 ms | 46.3 ms | −15.1 ms |
| Java | 63.0 ms | 57.2 ms | −5.7 ms |
| Go | 62.0 ms | 44.9 ms | −17.1 ms |
The raw clients agree within 8.9 ms — every runtime's HTTP stack is about equally fast, which is what you'd expect. The CCXT spans spread 24.7 ms, and each one differs from its own language's raw client in a different direction. For Go, JavaScript and Python the span comes in 14–17 ms below that language's own bare HTTP GET, in 6 rounds out of 6 — impossible as wire time, so those spans simply don't cover the whole request.
C# is the one that doesn't under-measure, which made it look slow. We chased that with a
throwaway local patch — a wire-only timer inside CCXT's C# — which shows the time really is
spent inside SendAsync plus the body read
(68.48 ms of a 68.72 ms span, so it isn't library bookkeeping), and a four-way handler comparison
— SocketsHttpHandler and HttpClientHandler, each with and without automatic gzip, all
interleaved in one process — puts CCXT's exact configuration at 69.8 ms against 63.4–71.0 ms for
the alternatives. CCXT's C# client is a normal C# client; two near-identical configurations
differed by 7.6 ms in that same run, which is the size of the effect we were trying to explain.
So the split is not comparable across languages, and we've dropped it. What is comparable is
the wall clock around fetchOrderBook — the same definition everywhere — measured interleaved,
round-robin, so every language sees the same network:
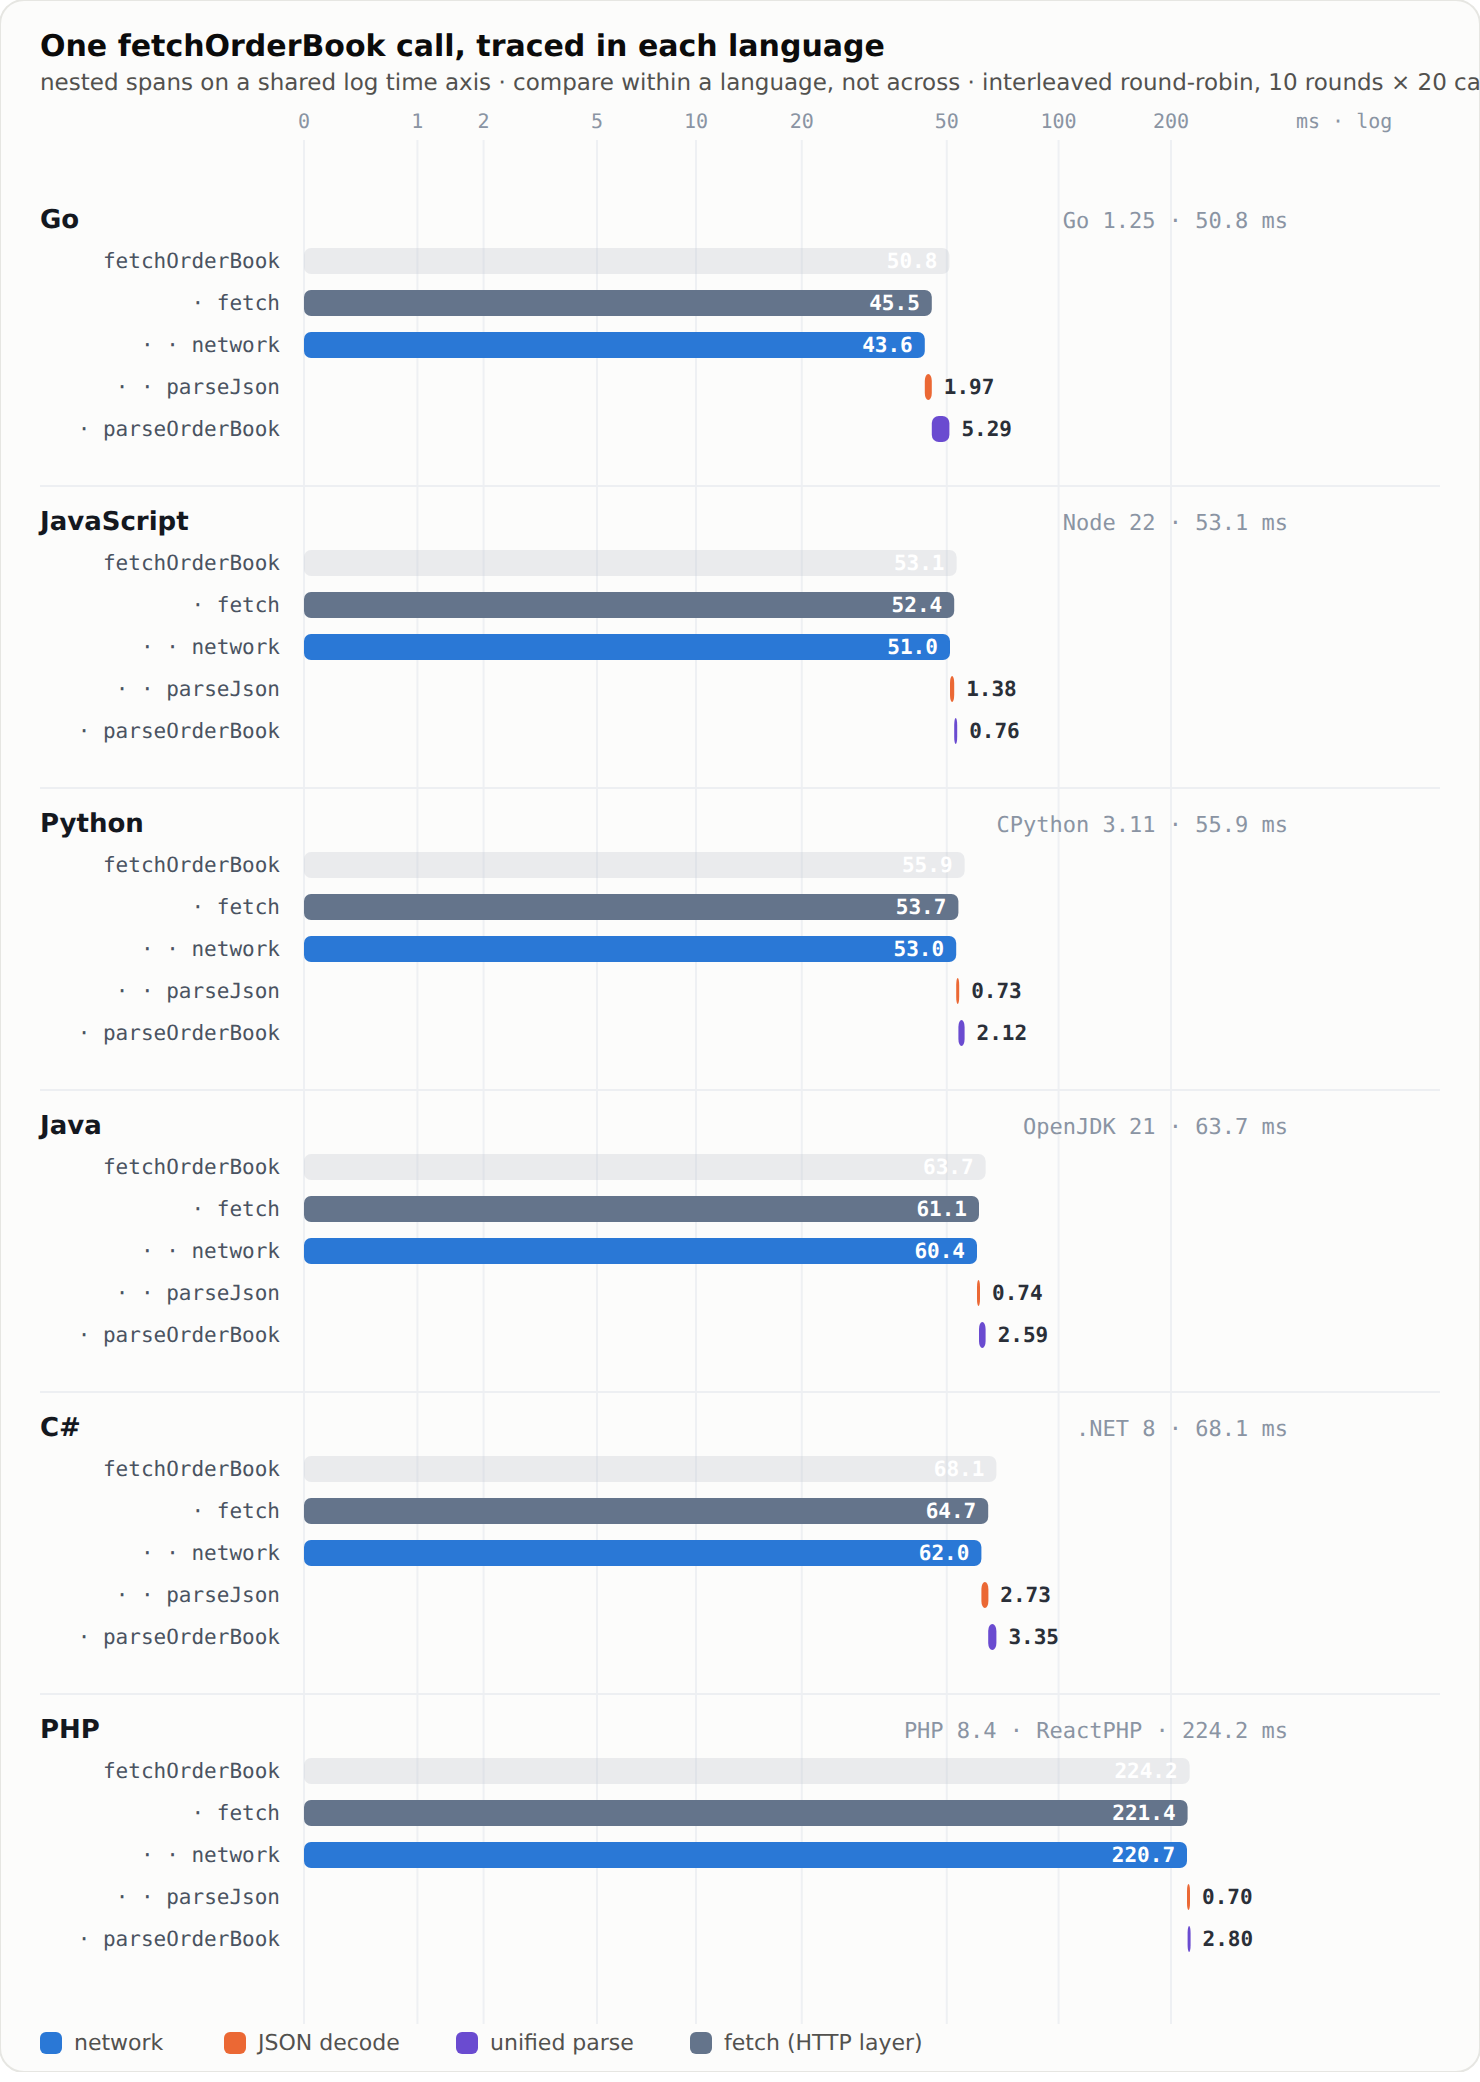
The trace above still shows the internal spans per language, because they're useful for seeing where time goes inside one implementation — just don't read the network bars across languages as a like-for-like comparison. The next section removes the network entirely, which is where the languages genuinely separate.
2. Latency with the network removed — where languages actually diverge
The network hides everything interesting. So the second test removes it entirely: parse a
synthetic 1,000-level order book — parseJson + parseOrderBook, the CPU-bound core of every
response — in a tight offline loop, and measure how long one parse takes. This is your latency
floor when the data is already in hand: backtesting on historical data, or replaying a deep book.
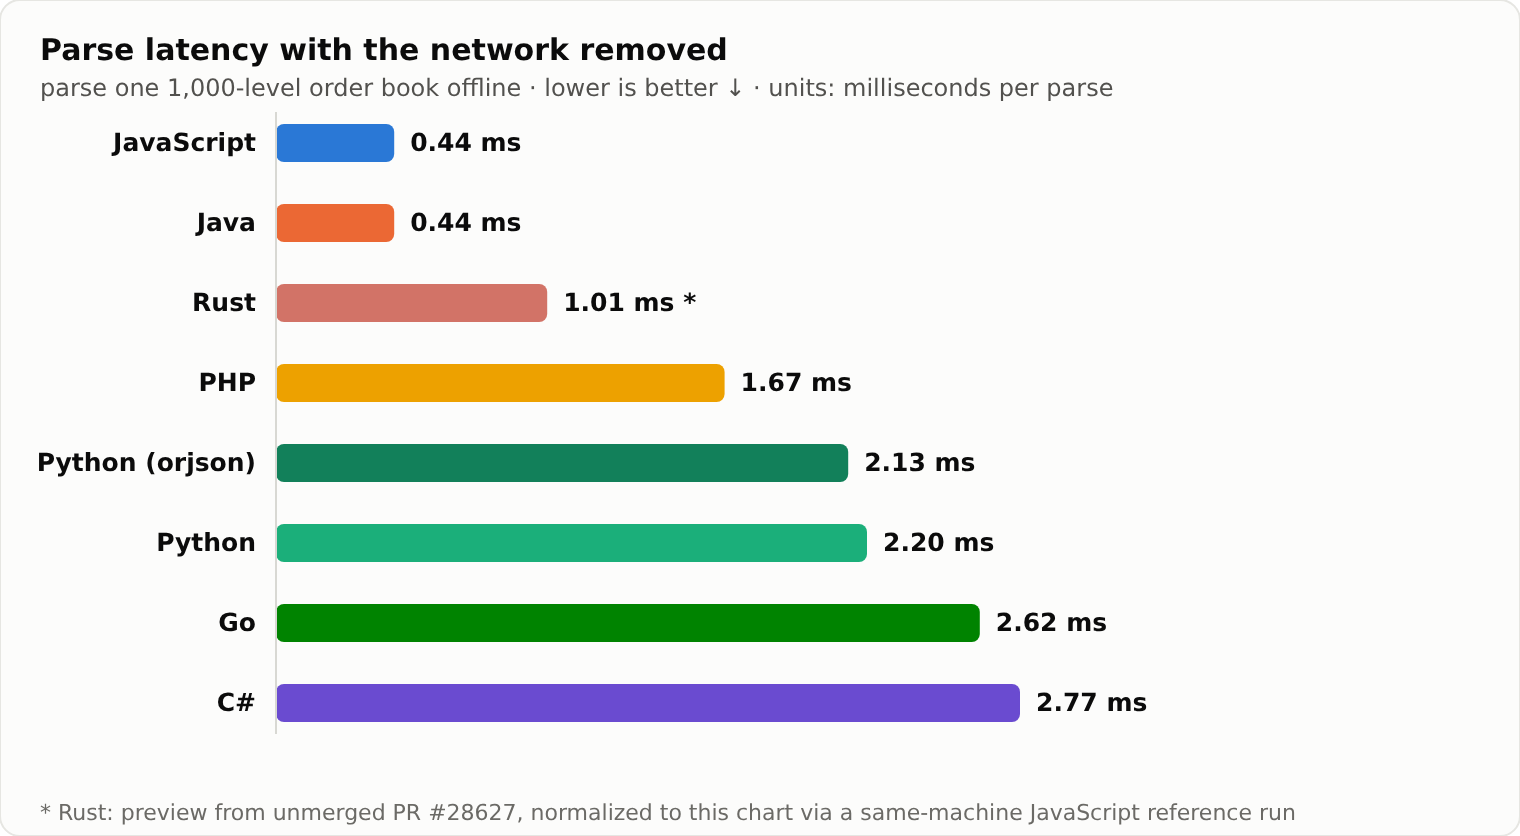
Now the languages spread across more than 6×, and the order is not what "compiled vs interpreted" would predict:
- JavaScript and Java tie at the top (~0.44 ms each) — their mature JITs turn the hot loop into specialized machine code.
- PHP (1.67 ms) sits in the middle.
- Python (2.20 ms), Go (2.62 ms), and C# (2.77 ms) cluster at the bottom — and yes, that puts the two compiled languages below interpreted Python.
Bonus: a first look at the Rust port
A Rust implementation is in progress in PR #28627. We ran the same benchmark against a snapshot of that branch: ~1.01 ms, third place — behind JavaScript and Java, ahead of Go and C#. Since Rust is also AOT-compiled with no tracing JIT, that ordering is a hint the boxing tax below is about how the code is generated, not about compilation.
This is a moving target — an unmerged branch measured at one moment, with the caveats in the methodology — so treat it as a rough early signal, not a result.
We also tried swapping Python's standard-library json for the fast Rust parser
orjson — shown as its own row (BENCH_ORJSON=1). It shaves
about 3% (2.20 → 2.13 ms) and no more: JSON decoding just isn't the bottleneck. The dominant cost
is CCXT's unified parseOrderBook, which a faster byte-reader can't touch. The next section is
why — and why the compiled languages land where they do.
3. Why are the two compiled languages the slowest?
This surprised us, so we dug into Go. The answer is not a measurement error — it's the transpilation model, and it's the same story for C#.
Splitting Go's 2.63 ms parse: parseJson is 0.87 ms and parseOrderBook is 1.83 ms. Inside
parseOrderBook, the cost is spread evenly across parsing each of the ~2,000 price levels — not
one hot spot. The reason is that CCXT's Go mirrors JavaScript's dynamic semantics:
- every price and amount is an
interface{}box (Go'sany), decoded viajson.UseNumberplus a recursive re-normalization pass; - every field read (
GetValue), every append (AppendToArrayon*any), and every number coercion (SafeFloat→ a type switch) is a generic, runtime-typed helper; SortBy's numeric comparator even callsreflect.TypeOf(...).Kind()on both operands of every comparison — a latent cost that stays cheap only because live order books arrive pre-sorted.
C# lands right next to Go (362 ops/s) because the AST transpiler emits the identical
object-boxing pattern — and it uses no dynamic, so this is plain boxing and virtual dispatch.
So why are Java and JavaScript ~6× faster on the same boxed, dynamic code? Tracing/tiered
JITs. V8 and HotSpot watch the hot loop, specialize on the object shapes, and eliminate the
boxing at runtime. Go's ahead-of-time compiler and .NET's JIT don't specialize this
any/object pattern nearly as aggressively, so the boxing and type switches run on every
iteration — which is how two compiled languages end up slower than interpreted Python and PHP.
The number is real, and it's the deliberate tradeoff of one-source-of-truth transpilation: a
hand-written Go parser using []float64 and sort.Slice would be an order of magnitude faster —
but then it wouldn't be generated from the single TypeScript source that keeps all six languages
in lockstep. For the network-bound REST path (§1) it costs nothing; for a tight parse loop, it's
the whole story.
| Language | Runtime | Parse latency | Throughput |
|---|---|---|---|
| JavaScript | Node 22 | 0.44 ms | 2,293 /s |
| Java | OpenJDK 21 | 0.44 ms | 2,280 /s |
| Rust * | rustc 1.94 | 1.01 ms | 988 /s |
| PHP | 8.4 | 1.67 ms | 598 /s |
| Python (orjson) | 3.11 | 2.13 ms | 469 /s |
| Python | 3.11 | 2.20 ms | 454 /s |
| Go | 1.25 | 2.62 ms | 381 /s |
| C# | .NET 8 | 2.77 ms | 362 /s |
* Rust is a preview from unmerged PR #28627, measured on a different machine and normalized via a same-machine JavaScript reference run (raw: 800 /s; the reference machine benchmarked 23% slower). See the methodology.
4. Memory
Holding the parsed books plus the runtime baseline, peak resident memory splits by runtime, and the ranking flips again:
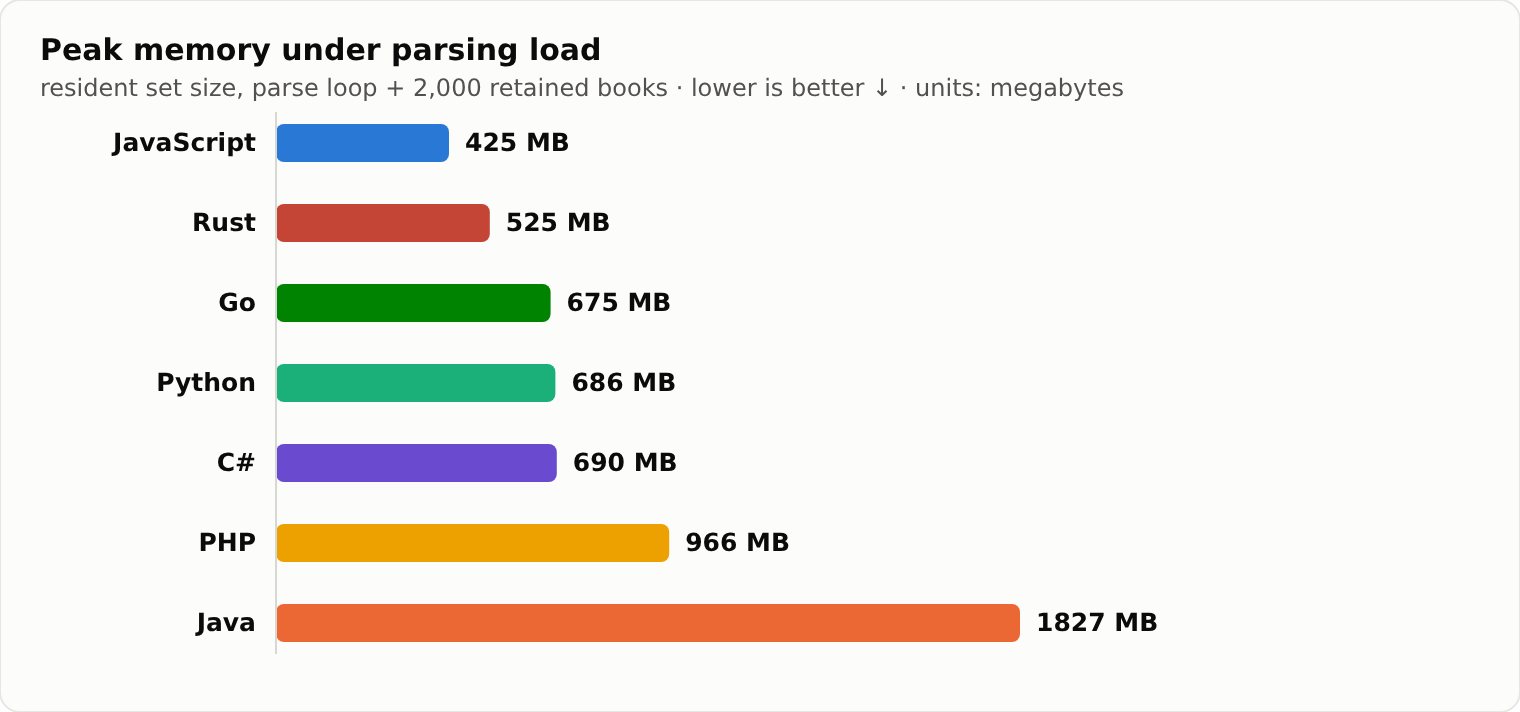
JavaScript is leanest (425 MB), with the Rust preview second at 525 MB; Go, Python, and C#
cluster around 675–690 MB; PHP's associative arrays push it to 966 MB; and Java's JVM, which
reserves a large heap up front, is heaviest at ~1.8 GB. That last figure is baseline-driven — a
production JVM with a capped -Xmx would be far lower — but it's the honest OS footprint out of
the box, and the reason the fastest parser is also the hungriest. If you run hundreds of instances
per host, Node and Go keep the smallest footprint.
Unlike the latency figures, these memory numbers needed no cross-machine adjustment: the JavaScript reference run reproduced its original per-book (145 KB) and peak-RSS (425 MB) values within 1% on the second machine, so memory transfers directly.
5. WebSocket: maintaining a live order book
The REST path is network-bound and the load test is pure compute; the WebSocket path is in
between — Coinbase's book is ~43,000 levels, updated many times a second, and every delta merges
into it. We watch it with watchOrderBook (JavaScript, Python, PHP and Go) and measure the
steady-state CPU per delta — the first update builds the whole snapshot, a large one-time cost we time separately
and exclude here:
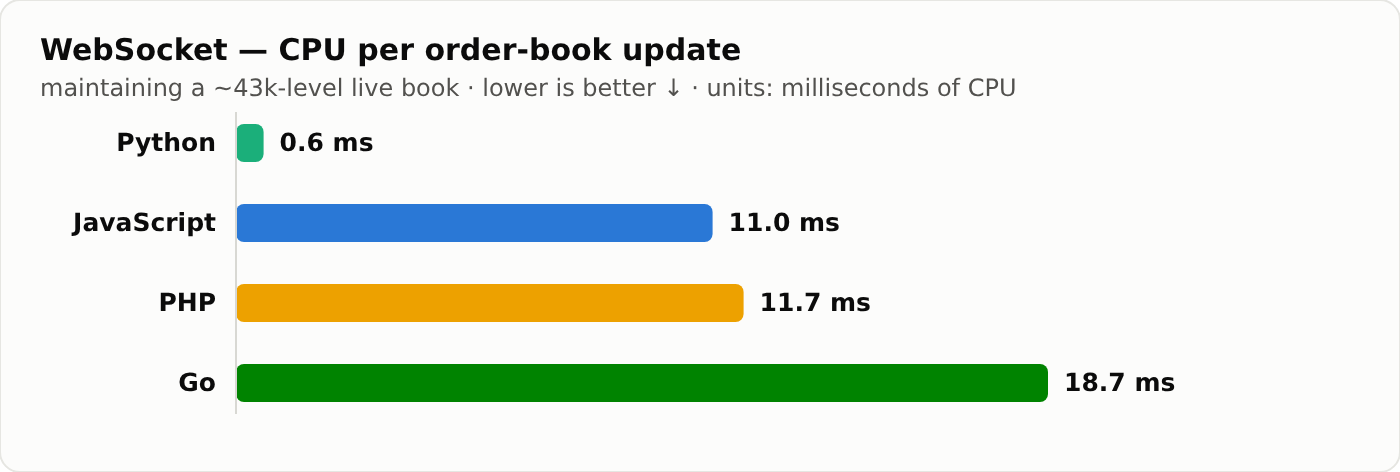
- Python: 0.6 ms — dramatically the cheapest.
- JavaScript (11.0 ms) and PHP (11.7 ms) sit in the middle.
- Go: 18.7 ms — the most expensive per delta.
Those really are milliseconds, not microseconds. It's a lot of CPU for one delta, and the reason is scale: the book is ~45,500 levels, and every new price level shifts an array of that size. As a sanity check, JavaScript parses 2,000 book entries in 0.44 ms offline, so ~45,500 entries works out to roughly 10 ms — right where the measured 11.0 ms per delta lands.
That 18× spread is not an apples-to-oranges comparison: we checked, and every language holds the
same book (~45,500 levels after the snapshot). The difference is in how each one inserts into
it. All of them keep the side sorted and do a binary search plus a shift, which is O(n) per new
price level — but the constant factor varies wildly. CPython's list.insert is a single C-level
memmove. CCXT's JavaScript side does two shifts per insert, and one of them —
this.index.copyWithin(index + 1, index, this.index.length) — walks the entire allocated index
buffer (sized to length × 2) rather than just the live portion, on an Array subclass that
doesn't get V8's fast-elements treatment. Go and PHP pay the same O(n) shift over boxed values.
In other words: this gap is a property of the per-language order-book implementation, not of the language itself, and the JS insert path looks like a genuine optimization opportunity.
None of this changes data freshness (the exchange's push rate sets that, and all four track it at ~50 ms between updates); it decides how much CPU headroom is left for your strategy while the book stays current. Note the one-time snapshot build ranges from ~1 s (Python, JavaScript, Go) to ~9 s in PHP.
| Language | Snapshot build | Steady gap p50 | Updates/s | CPU/update (steady) | Peak RSS |
|---|---|---|---|---|---|
| Python | 0.97 s | 49.7 ms | 19.8 | 0.6 ms | 162 MB |
| JavaScript | 1.69 s | 49.2 ms | 20.7 | 11.0 ms | 180 MB |
| PHP | 8.97 s | 49.8 ms | 16.7 | 11.7 ms | 116 MB |
| Go | 1.33 s | 50.1 ms | 17.4 | 18.7 ms | 105 MB |
6. What we're going to look into
Benchmarking your own library is uncomfortable in a useful way. Several numbers above aren't facts about a language — they're things we can fix. Here's the list we came away with, roughly in order of how much they're worth, with the code that produces them.
PHP's REST client should pool connections. This is the largest single win in the whole exercise: ~220 ms versus ~52 ms for everyone else, on every REST call, because the ReactPHP connector opens a fresh connection per request and pays a TCP+TLS handshake each time. Nothing about PHP requires that. A keep-alive pool would bring it in line with the other five.
The JavaScript order-book insert shifts more than it needs to. In
ts/src/base/ws/OrderBookSide.ts,
inserting a price level does two shifts, and the two are not bounded the same way:
this.index.copyWithin (index + 1, index, this.index.length)  // whole allocated buffer
this.index[index] = index_price
this.copyWithin (index + 1, index, this.length)              // just the live entries
this.index is a Float64Array grown by doubling (existing.length = this.length * 2), so the
first line can walk up to twice as far as the second — the tail it copies is Number.MAX_VALUE
padding. Bounding it to this.length, as the line below already does, looks safe. On a ~45,500
level book at ~20 updates/s that shift is most of the 11 ms of CPU per delta.
Go's SortBy does formatting work inside the comparator. In
go/v4/exchange_generic.go,
the string-key branch compares like this:
return fmt.Sprintf("%v", a) < fmt.Sprintf("%v", b)That's two allocations and a reflection-based format on every comparison of an O(n log n) sort.
The integer-key branch calls reflect.TypeOf(list[i]).Kind() twice per comparison for the same
reason. Both could resolve the type once before sorting instead of per-compare. The string branch
also orders numbers lexicographically, which is worth a second look on its own — it's fine for
13-digit millisecond timestamps, where every value has the same width, and not obviously fine
elsewhere.
Go decodes JSON twice. ParseJson runs decoder.UseNumber() and then walks the entire
decoded tree again in normalizeNumbers to convert every json.Number. For a 2,000-level book
that's a second full traversal of the structure. Converting during the decode would remove it.
Go's parseJson measures 0.87 ms of its 2.63 ms parse.
The boxing tax in Go and C# is the structural one. Every price is an interface{}/object,
and every field read, append, and coercion goes through a generic runtime-typed helper. That's
what puts two compiled languages behind interpreted Python in §2, and it's the deliberate price
of generating six languages from one source — but it isn't a law of nature. Typed fast paths in
the hottest helpers (GetValue, AppendToArray, SafeFloat) would recover part of it without
changing the transpilation model. This is the biggest job on the list and the least certain.
One caveat on all of these: the millisecond figures come from one machine on one network path, so treat them as pointing at where to look, not as the size of the prize. The reproducible parts are the mechanisms — an extra handshake, an extra traversal, an allocation inside a comparator — and those are worth fixing regardless of what any single run measures.
We also came away with a lesson about the benchmark itself, which §1 describes: don't attribute
latency to a language without a control run that removes the library. Our first draft did, and it
was wrong. The control now lives in
examples/benchmarks/net-baseline/.
Takeaways
- For REST, pick the language you like. The round-trip dominates and the five non-PHP languages sit in a ~20 ms band that is inside the minute-to-minute drift of the network itself. A raw HTTPS GET with no CCXT is equally fast in all of them (8.9 ms spread), so this is not a place where language choice buys you anything. PHP's ~4× wall time is the exception, and it is its HTTP client (a fresh connection per request), not the library.
- When you parse at volume, the runtime's JIT is everything. JavaScript and Java parse ~6× faster than PHP, Python, Go, and C# — and the two compiled languages, Go and C#, land slowest — because the transpiled code is boxing-heavy and only a mature tracing JIT specializes it away.
- Memory favors Node and Go. They keep the smallest footprints; the JVM is fastest but hungriest out of the box.
- The in-progress Rust port looks promising — faster than Go and C# in an early snapshot, though it's an unmerged branch and will move.
- For high-frequency WebSocket books, Python is remarkably cheap (~0.6 ms of CPU per delta) and Go is the most expensive (~19 ms); PHP's real cost is the one-time snapshot build, not the deltas.
- Bandwidth is a wash — same protocol, same bytes, every language.
- Several of these costs are ours, not the languages' — §6 lists what we're going to look into, from PHP's missing connection pool to an over-long array shift in the JavaScript order book.
There's no single "fastest CCXT." There's a fastest CCXT for your workload — and now there's a six-language benchmark you can run to find yours.
Run it yourself
The full harness — bench.mjs, bench.py, bench.php, and the Go, C# and Java programs — is
in
examples/benchmarks/:
# REST / WebSocket / offline parse-load, per language
node   examples/benchmarks/bench.mjs rest
python examples/benchmarks/bench.py  ws
php    examples/benchmarks/bench.php load
go run . load                              # from examples/benchmarks/go
dotnet run -c Release --project examples/benchmarks/cs load
gradle run --args=load                     # from examples/benchmarks/java

# ...or run every language and mode, aggregated into tables:
node examples/benchmarks/run.mjs
There's also an interactive, animated trace explorer —
examples/benchmarks/trace-explorer.html
— where you can replay one fetchOrderBook call in each language, toggle a linear/log time axis,
and hover any span for its exact share of the trace.
Methodology & caveats
- We do not report a network/processing split, on purpose. Instrumenting
fetchandparseJsongives a per-language span, but the control in §1 shows those spans don't cover the same work in each implementation — three of them read 14–17 ms below that language's own bare HTTP GET. REST numbers are therefore wall clock aroundfetchOrderBookonly. - REST runs are interleaved, not sequential. Each round runs all six languages round-robin,
so they share the same network window. The distribution in §1 pools every call across 7 rounds
of 30 (210 per language); the harnesses emit
latencySamplesMs, so any percentile can be recomputed from the raw data. Sequential per-language runs were what produced the bogus split in the first place.examples/benchmarks/net-baseline/holds the raw-client control programs. - Warmup is 15 calls (
BENCH_REST_WARMUP). The earlier 1–3 warmups left tiered JITs cold: Java's processing measured ~23 ms cold against ~3.3 ms warm. - The load test is offline and deterministic. The same synthetic 1,000-level book (integer
values, identical across languages), time-boxed to 8 s, so it measures pure parse throughput.
getrusageCPU counts all threads, so for multi-threaded runtimes (Go's GC, the JVM) single-threaded wall-clock throughput — not CPU-per-op — is the fair number. - WebSocket CPU is steady-state. The first
watchOrderBookbuilds the entire snapshot — a large one-time cost — so we time it separately and start the CPU counter only afterward; the reported CPU/update is the incremental delta cost, not the snapshot amortized across updates. - Memory is peak RSS at the end of the load run (parse loop + 2,000 retained books). It includes the runtime baseline, which is the point: the JVM's large default heap is real memory. Per-object deltas are unreliable on runtimes that pre-commit heap, so we report the OS peak.
- The Rust figure is a normalized snapshot, not a peer measurement. It comes from unmerged
PR #28627, measured after our original machine was
replaced mid-project. Throughput is rescaled via a same-machine JavaScript reference run (that
box benchmarked 23% slower; Rust's raw 800 ops/s → ~988), and the crate was trimmed to coinbase
so it would compile. Memory needed no adjustment — the JS reference reproduced its original
numbers within 1%. Raw and normalized values are both in
results.json.
Conclusion
Pick your language for the workload, not the benchmark. If you're calling REST endpoints, the network dwarfs everything and any of the six will do. If you're parsing at volume or merging deep order books, the runtime's JIT and the shape of the generated code decide it — and that ordering has little to do with whether the language is compiled. And several of the costs above are ours to fix rather than the languages' — §6 names them. The CCXT team is committed to continuously improving the library, so this is a roadmap as much as a report.